Master Data Management – Data Structure (part 1)
by Tom Oldham

Master Data Structure
In my two previous blogs about Master Data Management, I gave an overview describing what is Master Data Management and explained how to develop a Master Data Strategy. In this blog I am diving into the details about setting up Data Structures and highlighting best practices. Data Structures are the way data is organized and defined within the ERP.
After the Master Data Strategy is defined, then it is time to refine and implement the Data Structures. Master Data Structures are the secret sauce for effective and efficient business intelligence. I recommend starting with the most critical “pain points” identified in the process map. This may be as simple as adding a parent/child relationship to the existing customer record or as complicated as implementing a new smart model code structure. Also, addressing the need to put some standardized “intelligent groupings” around the business to ease the work required to understand trends and expose areas that need attention.
When setting up or updating the Data Structure, I find that it is easiest to look at things by functional areas – Finance, Corporate, Supply Chain, Marketing, Customer and Sales. Over the years, I have developed a list of best practices for each area. I am breaking this topic into two blog posts and will first go into detail about Finance, Corporate and Supply Chain. (I will cover Marketing, Customer and Sales in my next blog post.)
Data Structure Example – Finance
Much like standardizing a Chart of Accounts for Financial Reporting across your entire organization, Master Data Management can put standardized “intelligent groupings” around the rest of your business to ease the work required to understand trends and expose areas that need attention. Most companies have a good Chart of Accounts simply because that is required to produce financial statements. The Chart of Accounts is translated into the ERP.
Finance teams are under a lot of pressure when closing the books at the end of month, end of quarter and end of year. To help streamline the close and reconciliation of the books, the setup of the financial structure in the ERP is an imperative.
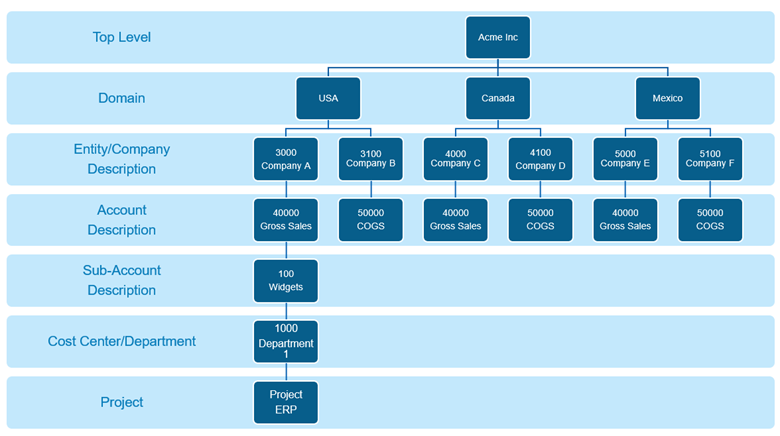
See a simple Finance Structure example below:

Hierarchical Layout:

As shown from the “Top Level” to Domain, Entity, Account, Sub-Account, Cost Center and Project – the discipline and process necessary for well-structured financial data should be taken to other parts of the business. When a new customer, supplier or product is created – that same attention to detail should be taken as when adding a new “Account” for your General Ledger. When setting up data structures teams should ask themselves the following questions and code as desired but in a smart and structured process.
• What are all the ways that particular customer, supplier or product can be identified and analyzed?
• What parts of the business will be aided by doing this?
• What other parts of the ERP system will be enabled by populating this data?
Data Structure Example – Corporate
Corporations measure their business leaders and teams on their results. To easily roll up the entities to a “company” level or drill down to the “site” level, the corporate structure needs to be defined and loaded into the ERP.
The setup is fundamental for any ERP system but there should be some “method to the madness”. There are many names used like Company, Entity, Site, Warehouse, etc. You need a simple structure built for your way of analyzing the business. As with the Chart of Accounts, this area is usually handled well by most since it is such a key component of an ERP system. Treating the different locations with smart coding is a great idea – offices grouped together, plants grouped together, and warehouses grouped together. Also, keep in mind that the business has “reorganizations” and the structure that you put in place should be flexible for adapting to future changes. An example would be adding a “world area” grouping even if the company is solely North American currently but the company vision is to be global in the future.
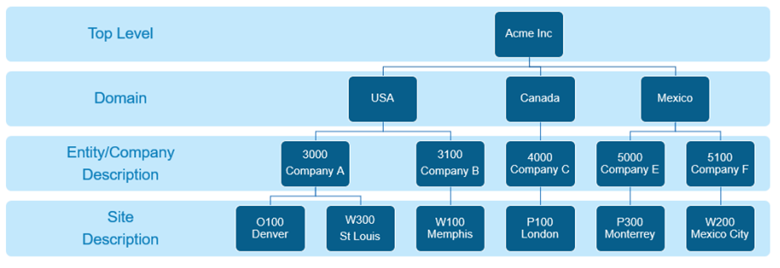
See a simple Corporate Structure example below:
Spreadsheet Layout:

Hierarchical Layout:

Note: Domain, Entity/Company and Site/Warehouse have a natural hierarchy and smart coding built in. This coding takes advantage of the Domain/Entity/Site structure. Also, using naming conventions like starting an Office site with the letter “O” or all Canadian companies are numbered from 4000 – 4999 makes data analysis and cleansing simpler. .
Data Structure Example – Suppliers / Vendors
An area of the business that is getting a lot of attention is Supplier Performance. With disruptions and inflation happening throughout the Supply Chain, it is no longer practical to analyze vendor data using off-line methods. Whether your company has corporate procurement teams or commodity teams working contracts for price agreement, these teams require ongoing vendor data to negotiate the best deals. To have timely, accurate and repeatable supplier data when analyzing supplier spend, pricing and performance it is absolutely necessary to have the required Master Data built into your data structure. Things to consider when setting up Supplier master data are:
- What kind of supplier are they?
- What market or industry they are in?
- Are they related to other Suppliers?
- Are they related to Customers?
- Are they both a Supplier and a Customer?
- Do they need to be grouped together for pricing or incentives?
A sign that Supplier Master Data Structure is lacking is if your employees must consistently massage the data to get it ready for analysis. They often have some “maps” or “codes” offline to help them do this. That data needs to be loaded into your ERP so all reports and analysis can get the same answer. A common attribute that would benefit from being in the ERP Supplier Master Data is “type.” Once “loaded and coded” the commodity managers can quickly pull all purchases for a specific “type” and see if its tracking higher or lower than the producer price index for that commodity. By saving purchasing teams hours of manually developing reports, they have more time for working vendor programs to improve costs, lead-times and quality. And all of this helps with analyzing the all-important Supplier “spend” analysis.
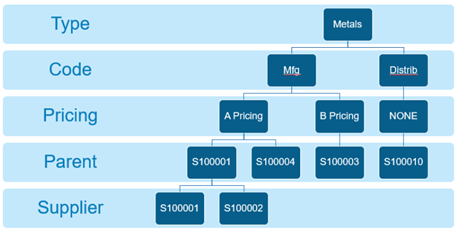
See a simple Supplier/Vendor example below:
Spreadsheet Layout:

Hierarchical Layout:

Note: Details to consider in this example are that Suppliers begins with an “S”, Sort Name has some intelligence built in and the remaining codes have meaning for supplier analysis. When there is no value for a particular supplier for a particular field, a best practice is to input an actual value such as “blank” or “none”.
Additional Thoughts on Master Data Structure
Often the optimal data structure is not set up in the system because it is too time consuming to load or maintain. This is when the IT department needs to develop automation tools to support configuration management. Also, when you hear a team member say it can’t be done, check with the ERP vendor or your BI vendor. ERP systems are much more sophisticated now and can handle complex reporting structures, supply chain strategies and pricing policies. There should be very little “offline” data and manual manipulation needed for daily, weekly, monthly, quarterly or annual reporting. Reach out to a consultant if your team is having difficulties.
In my next blog, I will expound upon best practices for Data Structures within Marketing, Customer, and Sales.
Author: Tom Oldham, CMA, CFM, is a Product Manager at Cyberscience focused on Manufacturing Solutions.

Recent Comments