Master Data Structure
In my last blog, I introduced the topic of Data Structures, the way data is organized and defined within the ERP. I highlighted best practices for finance, corporate and supply chain. I am continuing the discussion of Data Structures, and diving into Marketing, Customer and Sales best practices. There is a lot of content to cover and I promise if teams follow these best practices your business intelligence process will run much smoother.
Data Structure Example – Marketing / Product
Setting up Data Structures for marketing is focused on how the company’s products are defined in the ERP. SKU or Item Number codes are rather proprietary and hard to change but as the company grows and product lines are added existing product structures may no longer meet the needs of the business. Hopefully there is some “smartness” in the coding structure. For example, the length, width, size, diameter, composition, etc. are often part of the product code in question. If not, this “smart coding” should be done in the fields or attributes available in the ERP system directly related to this product. Often there is data offline that team’s reference that describes the Product and is used for various analysis. You must get this “online”! It is important or else you will become lost in the spreadsheet/VLOOKUP world.
Some questions to ask when setting up Product or SKU’s and related fields:
-
- What are your products?
- How do you price them?
- How do you market them?
- What differentiates one part from another?
- What is the sales strategy around these products?
- Where are they manufactured or purchased?
- How does Accounting view these products from a financial perspective?
- How do you measure your Inventory?
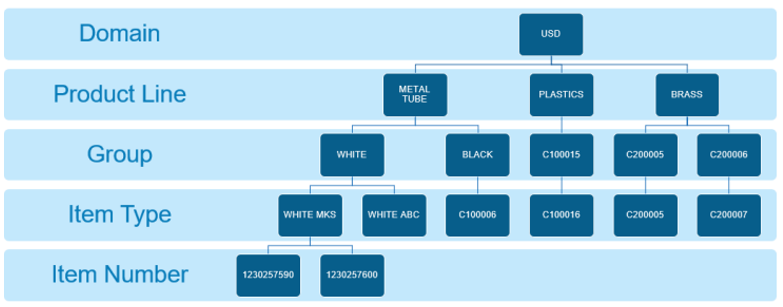
Another important note to strengthen your BI is to build a hierarchical or parent/child structure into your products. This will allow drill-down and analysis from summary level to the details with ease and very little work. This is represented by the Product Line, Group and Item Type in the example below.
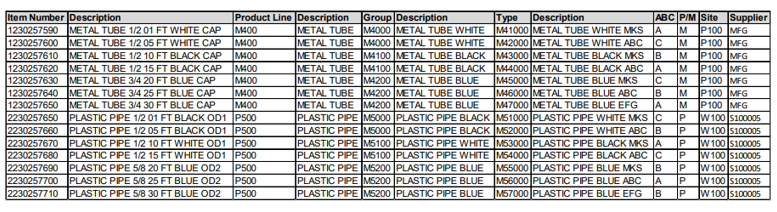
See a simple SKU/Product Master example below:
Hierarchical Layout:
Product Master Data Structure Best Practices:
Alphanumeric characters: One other best practice is to use only alphanumeric characters in your part numbers if possible. Adding other characters often “confuses” spreadsheet or other analysis tools. And no leading “0’s” if possible! Spreadsheets do not like leading a leading “0”.
Smart Model Codes: Item Numbers or SKU’s are quite proprietary and often hard to change but many companies have built smartness into them – each segment of the code means something. This is typical in a Configured to Order (CTO) manufacturing model.
Hierarchical Structure: It is also important to build a hierarchy or structure here – in this case using Product Line\ Group\Type\Item Number. Your BI tools will love this structure and queries will be easier to build.
Extended Product Master: Using the additional fields within the ERP is very useful. These items can be customized to your specific industry needs. Examples of some data that I have seen inputted in the extended product master are – Item Number/SKU – one to one with ERP Product Master, Tariff Code, Size, Volume, Alternate Code, Sales Code, UPC.
All these details must be taken into consideration when setting up your product data and reviewing the fields or ERP relationships available to you. Consultants or your IT/Finance team should be part of the review.
Data Structure Example – Customer
Customers and related analysis can get very complicated, but we will try to stick to the basics here as we did with Product.
There can be many ways to “group” customers and which is best depends on how your management team defines customer segments. Most ERP systems do a good job of giving you the flexibility you need outside of the common Customer and Address Master. Some standard segments are by sales channel, industry, and region. Other modules (whether it be Pricing or Sales related) will allow you to “group” customers however you need – as long as you have the tools to maintain these structures “en masse” via automated loads included in the ERP or built by consultants/developers. Having the right tools is a key issue not to be overlooked.
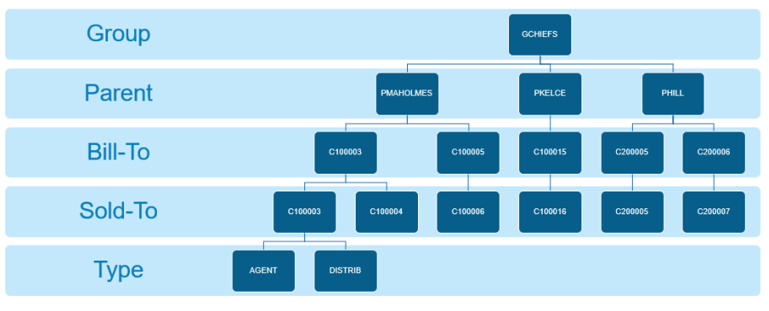
Like the Marketing recommendations, the Customer data structure it is important to build in a hierarchical or parent/child structure to give the “best” data you have to your BI tools. That is represented by the Group/Parent/Bill-To/Sold-To fields below. BI tools love a good “data model” or structure with drill-down structure built in. That is hugely important to help maximize ERP to drive BI.
Here are questions to think through for Customer setup and maintenance:
-
- Who are your customers?
- What are the relationships between customers?
- What kind of customer structure do you want (hint: Bill-To, Sold-To and Ship-To)?
- What markets are they in?
- What is your sales force structure?
- Consider all sales reporting – are there many ways that you report this?
- Do not overlook pricing – form a team to take advantage of what your ERP system offers.
- Do not overlook incentives and discounts in the same manner.
- Are they also a Supplier/Vendor?
- How do you want to treat customers from a financial perspective?
- What are all the “groupings” of customers that you look at today and want to in the future?
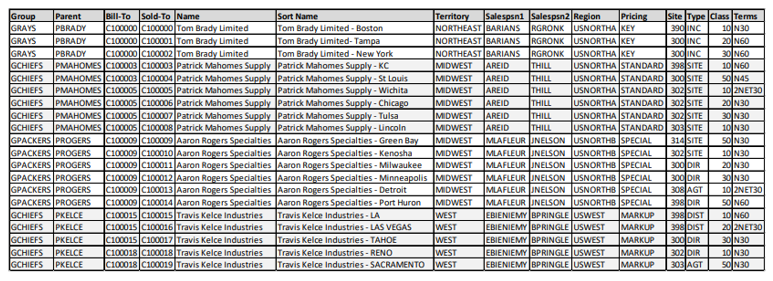
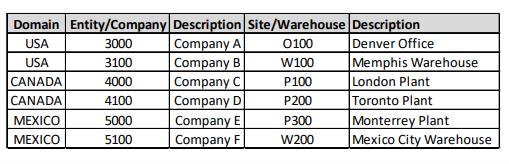
See a simple Customer example below:
Spreadsheet Layout:
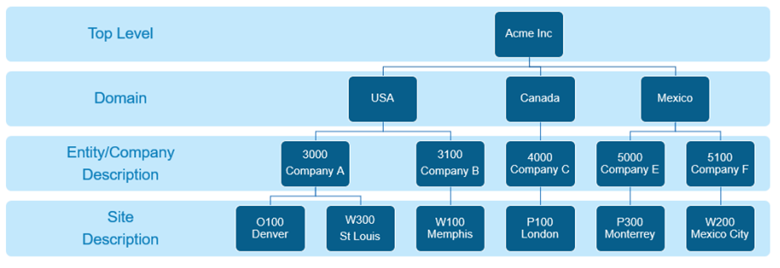
Hierarchical Layout:
Customer Master Data Tips
Tip 1: You can also build some “smartness” into your primary Sold-To or Customer number but be careful! If your customer base is rather dynamic with lots of acquisitions or constant changes be careful. ERP systems can build a lot of data and history – changing these primary customer codes can be difficult if you have a large amount of data. There are workarounds for this – the other fields can prevent this problem – especially Group, Parent and Bill-To. Build the smartness into the fields around the “Sold-To/Customer” and you will be good. For example, “point” customer records to another code and build in a parent-child structure. In this case we are using Group →Parent →Bill-To→Sold-To→Ship-To. “Ship-To” is not shown above since this is a customer record – but it is still part of the normal ERP and customer structure. Smaller companies may not be this complicated, so you only have a Group→Bill-To→ Ship-To structure. Whatever works for you. Also, with the customer structure we have a sales force structure built in using Territory→Salespsn1→ Salespsn2.
Tip 2: Investigate loading your customer’s structure into your ERP if it is not too difficult. For example, “Region” above can represent the customer’s structure and you can report back to them the way they see themselves – this is very helpful when managing rebate programs or preparing for a partnership review for example.
Tip 3: Create an “extended” table if you need extra fields. I have seen this used for things such as:
Customer or Sold-To Code – one to one with ERP Customer Master, Parent, Group, Mail-To, UPS Account, FedEx Account, Invoice Type – Values of Email, EDI or Paper.
Data Structure Example – Sales
And finally, as a last example, your sales organization should not be ignored and should be fully implemented into your ERP system for sales reporting, commissions, etc. It is not unusual to add fields to accommodate this structure. This is another area where “extended tables” is commonly used.
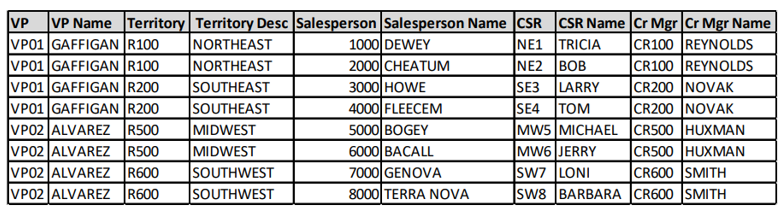
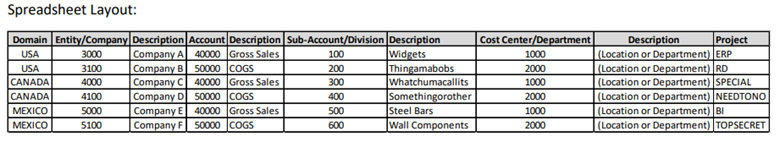
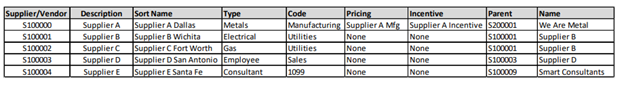
See a simple Sales example below:
Spreadsheet Layout:
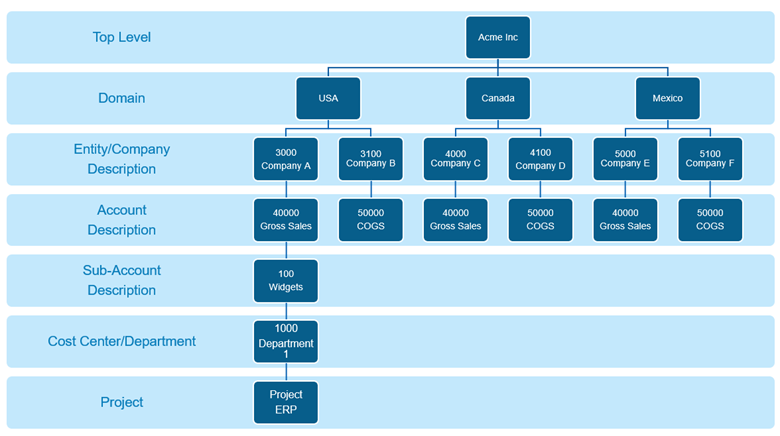
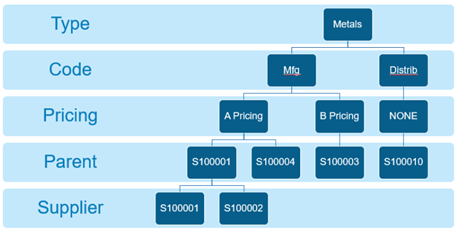
Hierarchical Layout:
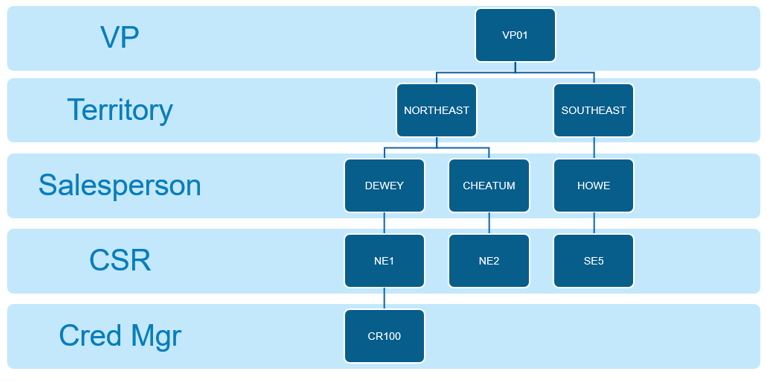
All levels of reporting should find a home – note the VPTerritorySalespersonCSR Cr Mgr structure above. “CSR” is Customer Service Representative and “Cr Mgr” is Credit Manager. This is a great idea to align your sales, inside sales and credit department for best servicing your customer if it is a fit. I recommend loading it all into the ERP system to maximize your analytics and performance in these areas.
Final Thoughts on Master Data Structure
I’ve covered a lot of material and it may seem overwhelming – especially if you have large data sets to begin with. To get started on making improvements, begin with the biggest pain points identified during the Master Data Management Strategy. If your team becomes stuck, instead of accepting the status quo and living with endless Excel manipulation, reach out to experts. At Cyberscience, we can support your Master Data improvement journey.
My next blog will provide insights about the infrastructure and resources need to maintain Master Data.
Author: Tom Oldham, CMA, CFM, is a Product Manager at Cyberscience focused on Manufacturing Solutions.


Recent Comments